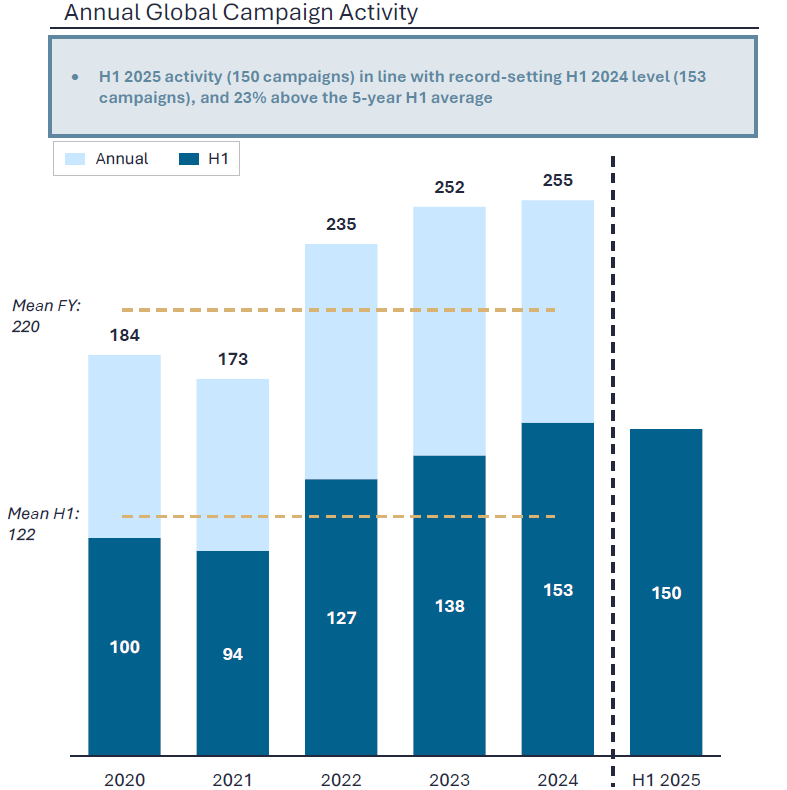
Global Campaign Activity Remains Elevated
New campaign activity in H1 2025 held steady at 150 new campaigns globally, in line with H1 2024’s record-breaking level of 153 campaigns. First-time activists remained an important force, representing 42% of funds waging H1 campaigns and 31% of H1 campaigns launched.
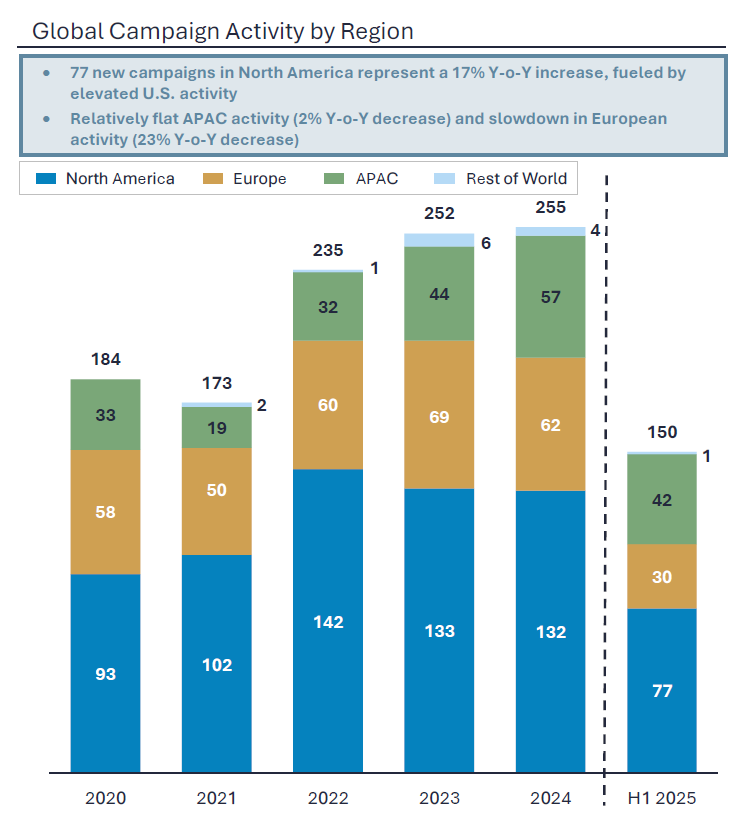
Global Campaign Activity by Region
-
North America: 70 new campaigns in the U.S. (+13% year-over-year) and 7 in Canada (up from 4 in H1 2024) fueled 17% year-on-year growth in North American activity.
-
Europe: 30 new campaigns were consistent with the historical five-year average but reflected a 23% decline versus the record levels observed in both H1 2023 and H1 2024.
-
APAC: With 42 campaigns, APAC remained steady compared to H1 2024's 43 campaigns, fueled by activity in Japan that already nearly matched 2024’s record full-year total.
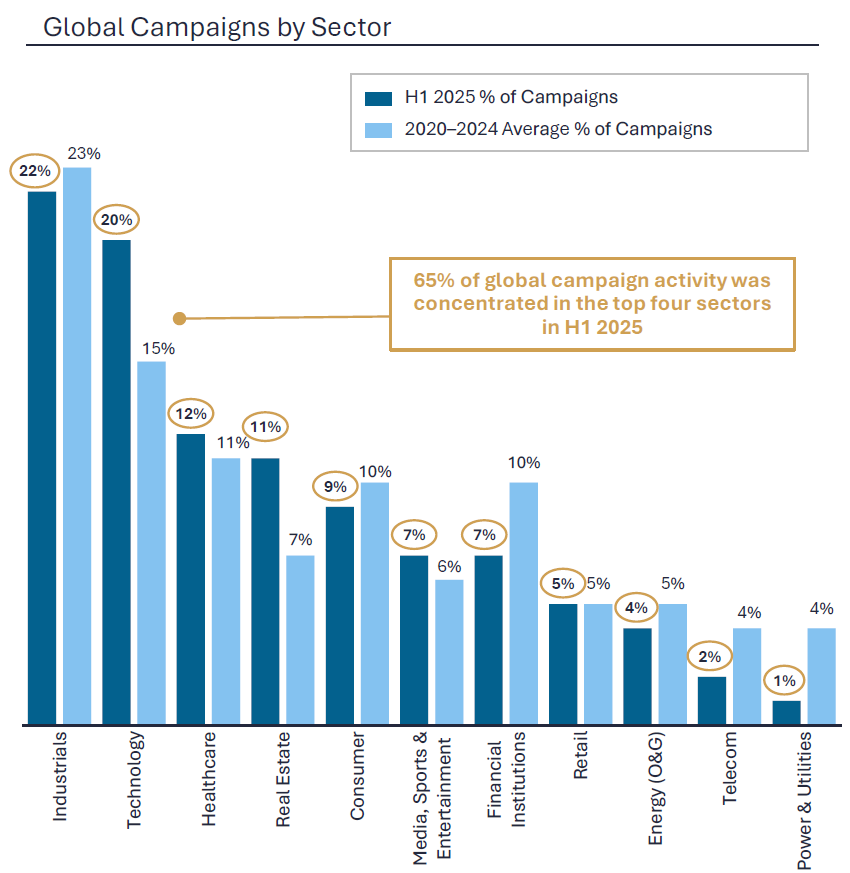
Global Campaigns by Sector
-
Top targeted sectors globally: Industrials (22%), Technology (20%), Healthcare (12%) and Real Estate (11%) collectively accounted for 65% of global activism activity in H1 2025.
-
North America: Technology remained the most targeted sector (26% of North American activity), with a significant increase in Software campaigns pushing for operational or strategic change.
-
Europe: Healthcare became the most targeted sector (20% of European activity), outpacing historically lower levels.
-
APAC: Industrials dominated (40% of APAC campaigns), followed by Technology (21%), Consumer (10%), and Media, Entertainment & Sports (10%).
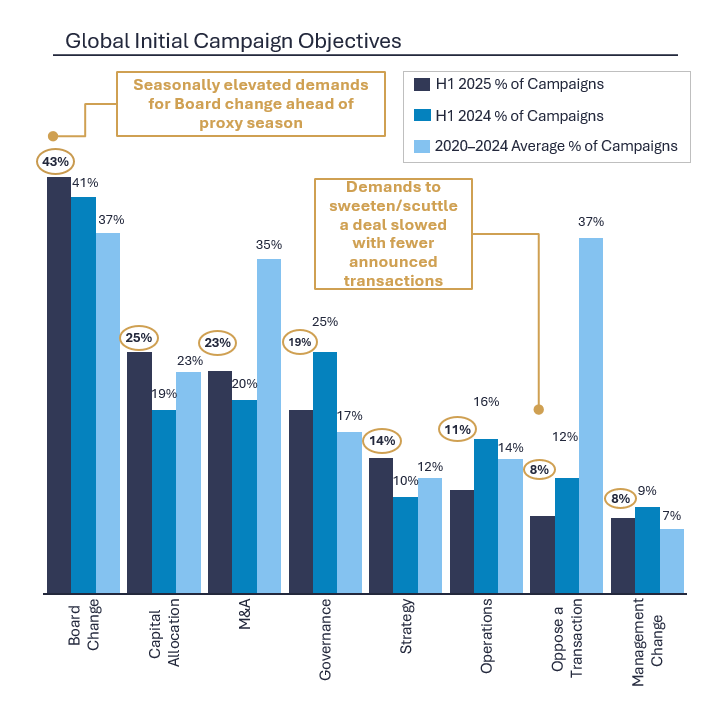
Global Campaign Objectives
-
Board change: Arising in 43% of global campaigns, Board change remained the most prominent demand, driven by seasonally heightened activity leading up to the U.S. proxy season.
-
Capital allocation (25%), M&A (23%), and Governance (19%) were additional frequent objectives.
-
Opposition to transactions (8%) slowed, significantly lower than the five-year average of 37% and coinciding with fewer announced deals.